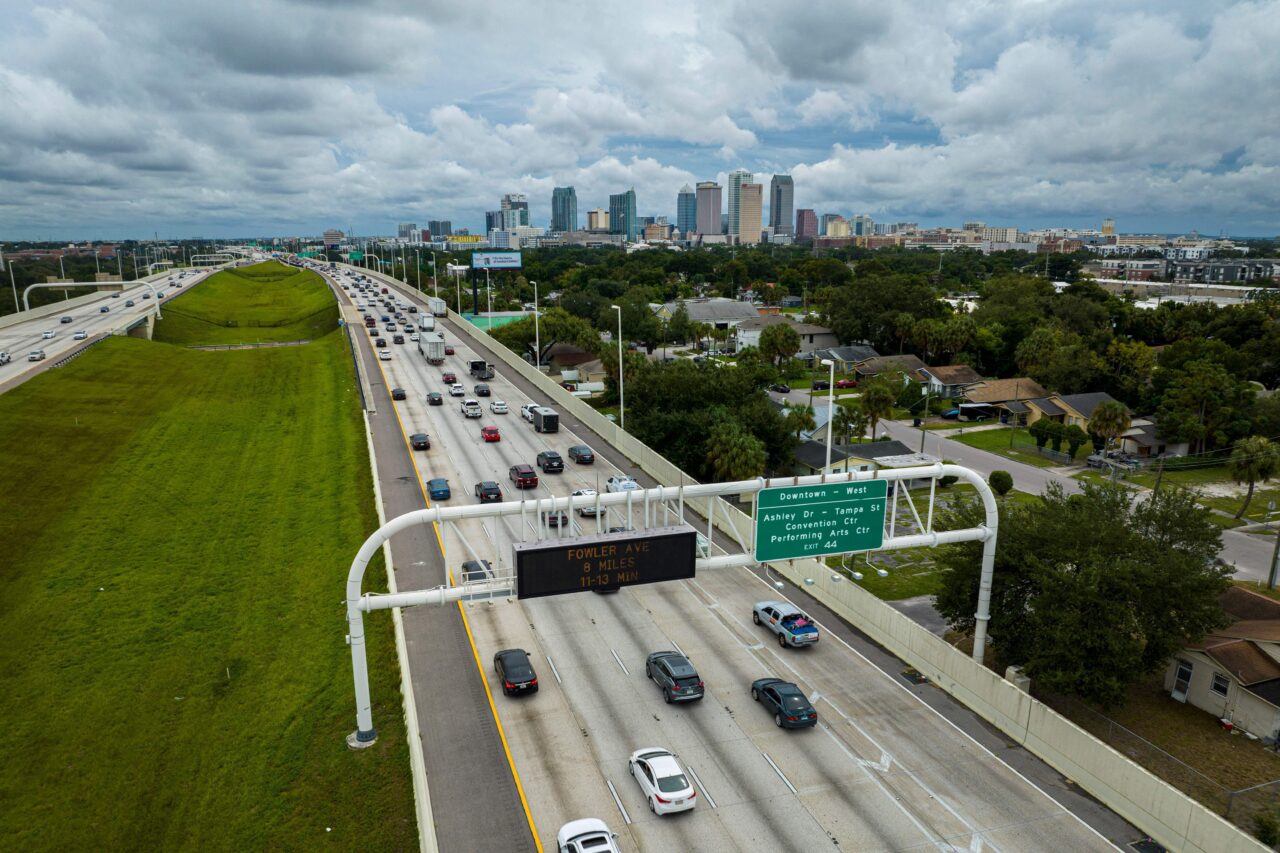
Eastbound traffic crowds Interstate 275 as people evacuate before the arrival of Hurricane Ian in Tampa, Florida on September 27, 2022. - The US National Hurricane Center (NHC) said Ian made landfall just southwest of the town of La Coloma, Cuba, at about 4:30 am local time (0830 GMT). The hurricane was packing maximum sustained winds of 125 miles (205 kilometers) per hour, the NHC said, making it a Category 3 storm on the Saffir-Simpson scale. (Photo by Ricardo ARDUENGO / AFP) (Photo by RICARDO ARDUENGO/AFP via Getty Images)
Traffic congestion got much worse in 2022 but is still below pre-pandemic levels
The typical U.S. driver lost 51 hours to congestion in 2022, about an hour each week. That's 15 more hours lost to congestion than in 2021.
By David Schaper/NPR
Eastbound traffic crowds Interstate 275 as people evacuate before the arrival of Hurricane Ian in Tampa, Florida on September 27, 2022. - The US National Hurricane Center (NHC) said Ian made landfall just southwest of the town of La Coloma, Cuba, at about 4:30 am local time (0830 GMT). The hurricane was packing maximum sustained winds of 125 miles (205 kilometers) per hour, the NHC said, making it a Category 3 storm on the Saffir-Simpson scale. (Photo by Ricardo ARDUENGO / AFP) (Photo by RICARDO ARDUENGO/AFP via Getty Images)
Millions of Americans returning to the office but getting there primarily by driving instead of taking public transit led to a significant increase in traffic congestion last year, according to a new report.
The typical U.S. driver lost 51 hours to congestion in 2022, about an hour each week. That’s 15 more hours lost to congestion than in 2021, and all that time wasted in traffic jams hit pocketbooks hard, costing the average American driver $869 in lost time, according to 2022 Global Traffic Scorecard by the mobility analytics firm Inrix.
But traffic congestion across the country is still only about half of what it was before the Covid-19 pandemic, as the report indicates the amount of time drivers lost on average in bumper-to-bumper gridlock was about 50 percent below 2019’s.
The Inrix report said the lessening traffic congestion patterns resulted from higher gasoline prices and the shift to hybrid work, with many office workers continuing to telecommute and work remotely at least some of the time.
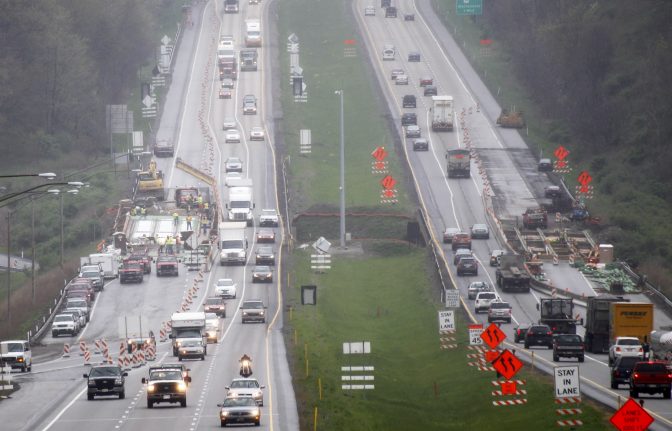
Keith Srakocic / AP Photo
Traffic moves from three lanes to two on Interstate 79, Wednesday, May 4, 2011, while workers continue work on the bridge deck over Mingo Road in Wexford, Pa.
“2022 was shaping up to be a year of re-emergence and a return to a new, post-pandemic behavioral norm, but that halted with the rise in oil prices, supply chain disruptions, and inflation,” said Bob Pishue, transportation analyst at INRIX.
“We continued to see a rise in global vehicle-miles traveled, a return toward traditional morning and evening peak commutes, growth in public transportation use, and continued gains in downtown travel,” Pishue added. “However, we have yet to fully rebound to pre-pandemic levels, and while we do anticipate a gradual increase over the coming years, we may see a small decline in 2023 should a global recession strongly take hold.”
Chicago drivers suffered the worst congestion among U.S. cities, wasting an average of 155 hours in commuting traffic last year, with an annual of cost per commuter of $2,618, followed by Boston (134 hours, $2,270), New York (117 hours, $1,976), Philadelphia (114 hours, $1,925) and Miami (105 hours, $1,773).
Los Angeles, San Francisco, Washington, Houston and Atlanta rounded out the top 10 U.S. cities with the most commuting time lost to congestion.
Globally, only London had worse congestion than Chicago in 2022, with drivers there wasting an average of 156 hours in traffic congestion for the year. Paris ranked third, with drivers there losing an average of 138 hours to congestion.
Interestingly, Chicago and Miami are the only U.S. cities in the top 20 where congestion is worse than it was before the pandemic. In Miami, the amount of time drivers lost to congestion last year soared 30 percent from 2019 levels, while Chicago’s time lost is 7 percent higher than in 2019.
Inrix says the company uses anonymous data from smart phones and GPS devices in cars, trucks and other vehicles, as well as data from other sources, to measure the congestion status of every segment of road for every minute of the day.
9(MDA3ODQwMjM3MDEzMTEwNDMwODdjYWVmYw001))