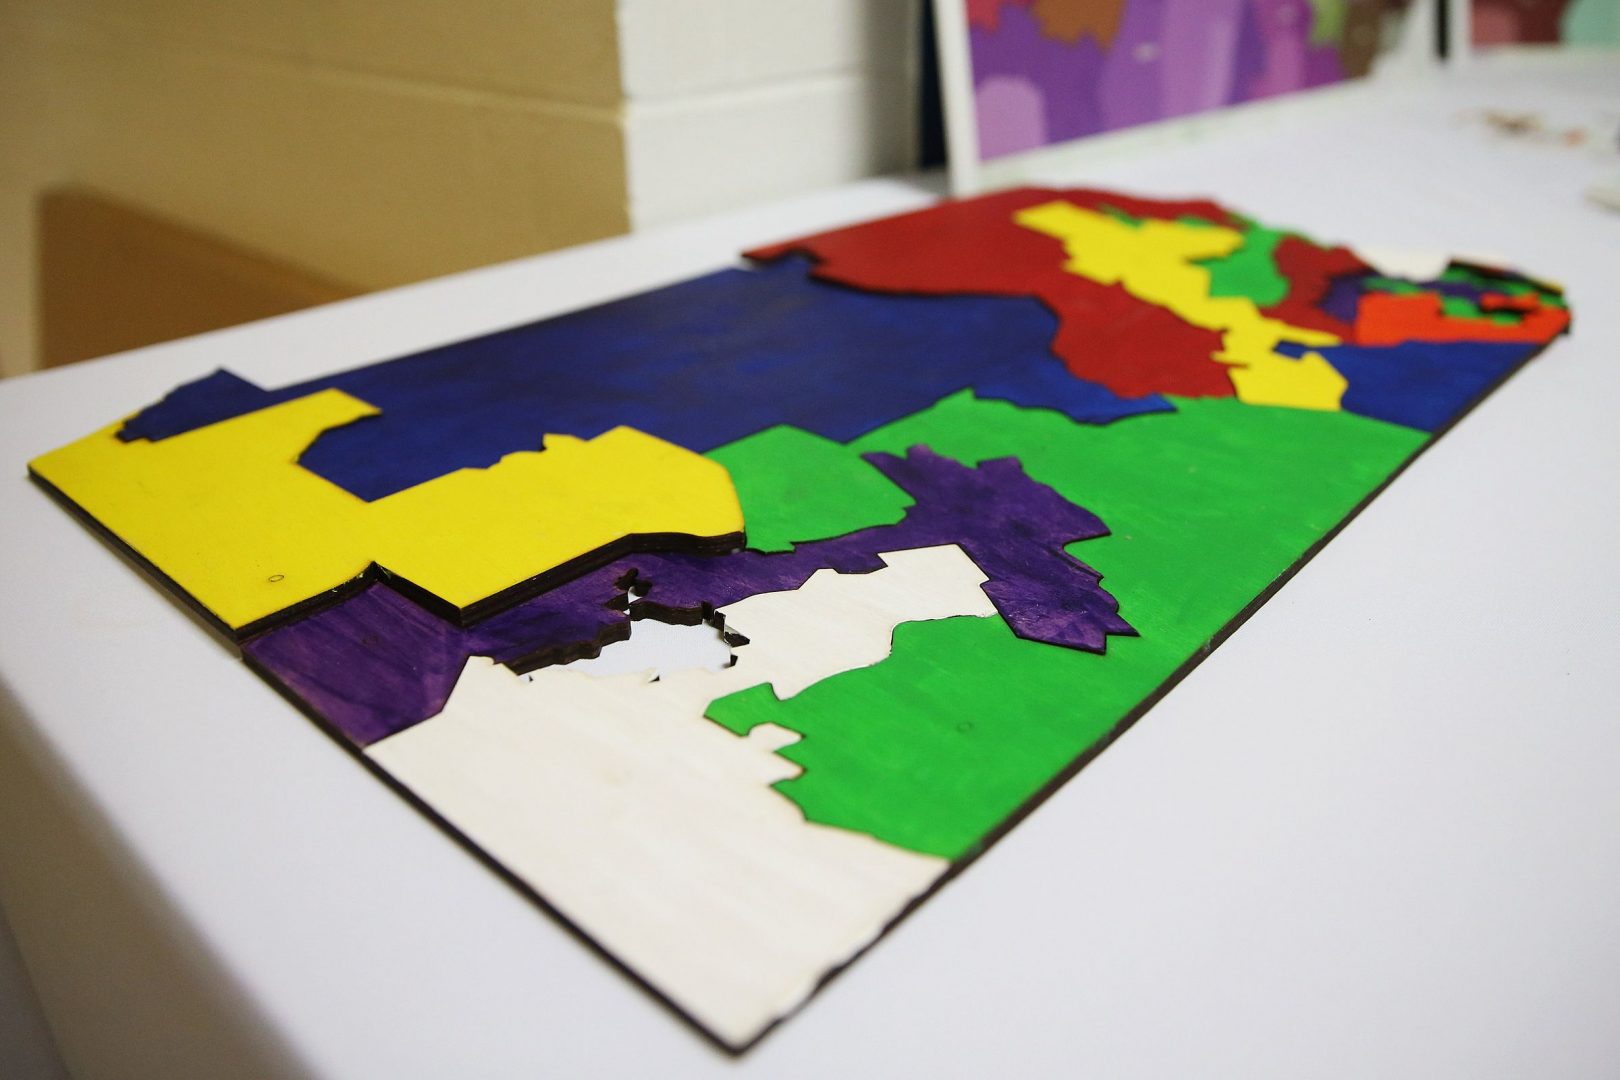
The delivery of new census data means the redrawing of Pennsylvania's political maps can begin.
Tim Tai / Philadelphia Inquirer
The delivery of new census data means the redrawing of Pennsylvania's political maps can begin.
Tim Tai / Philadelphia Inquirer
Tim Tai / Philadelphia Inquirer
The delivery of new census data means the redrawing of Pennsylvania's political maps can begin.
This article is part of a yearlong reporting project focused on redistricting and gerrymandering in Pennsylvania. It is made possible by the support of Spotlight PA members and Votebeat, a project focused on election integrity and voting access.
(Harrisburg) — A proposed congressional map put forth by Pennsylvania House Republicans meets fairness standards set by the state’s highest court but benefits the GOP, a likely sticking point as negotiations begin within the legislature and with Democratic Gov. Tom Wolf.
Advocates believe the map — created by former Lehigh County Republican Commissioner Amanda Holt, who a decade ago helped spur the movement for fairer districts — is a good starting point that could be improved to better reflect the partisan makeup of the state. Major party registrations are split roughly 50-50, but the map gives Republicans an advantage.
The House State Government Committee is set to vote on it Monday, but the debate over what the final product should be will last weeks.
“We have a long way ahead of us to get a map finalized in the commonwealth,” Rep. Seth Grove (R., York) said during a Thursday meeting. “There’ll be committee amendments, there’ll be floor amendments, there will be amendments to this as we move forward.”
The Pennsylvania Constitution is silent on what makes a fair congressional map. But because of a previous challenge taken up by the state Supreme Court, we know the standards a map could be judged by.
Here are some of those measures, and how the House Republicans’ proposal stacks up:
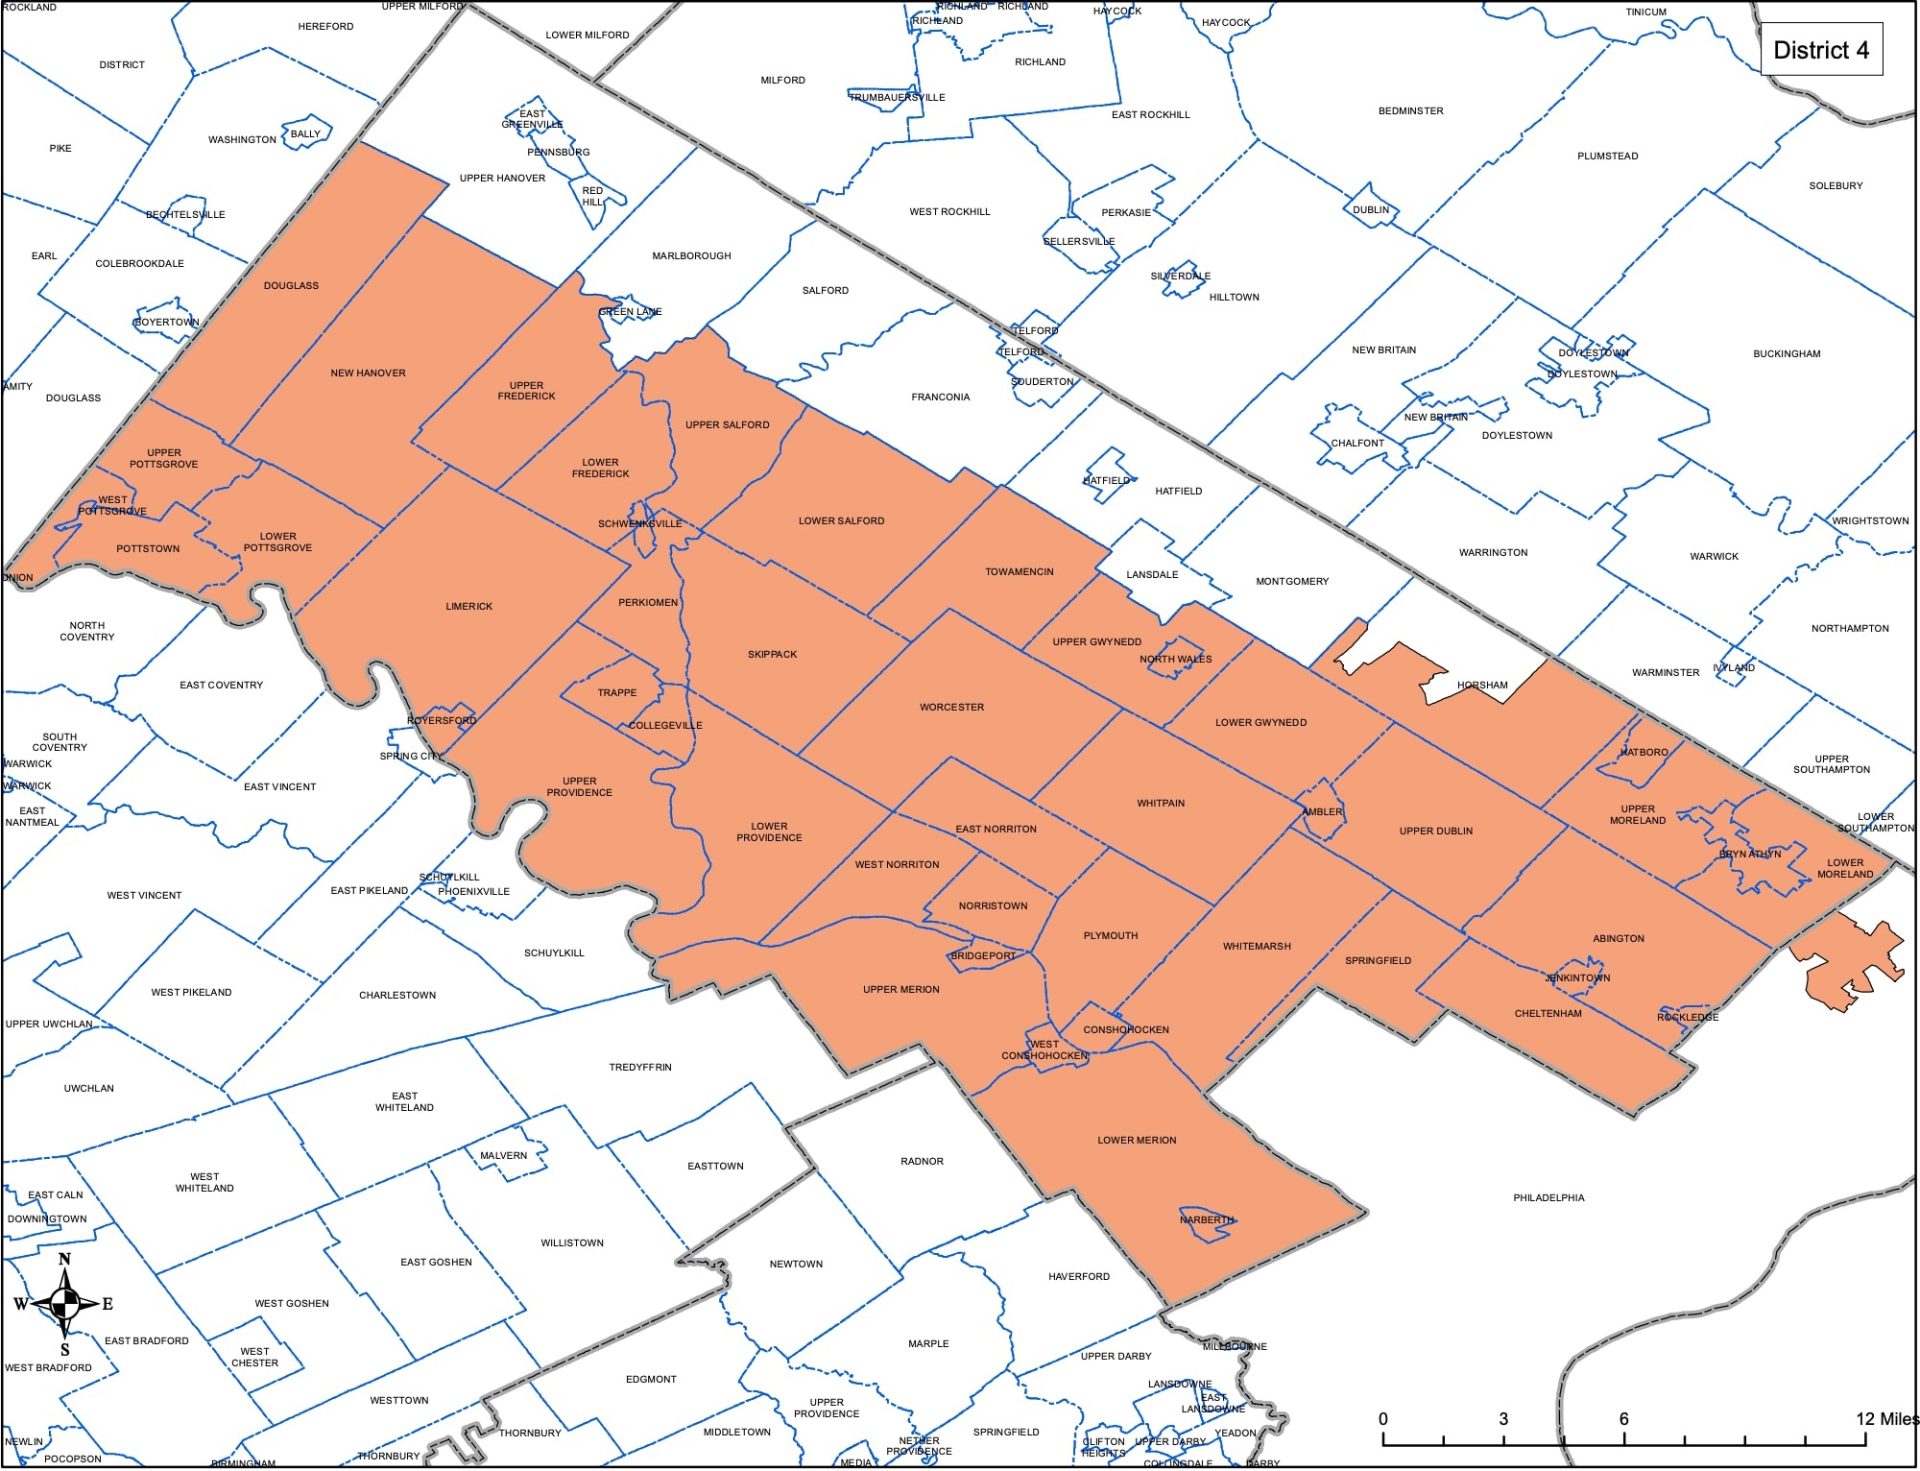
Districts should be in one whole piece, with all their precincts connected. In other words — no part of a district should be completely detached.
Holt’s map successfully fulfills this requirement.
Screenshot of map via House State Government Committee
Proposed District 4 meets the standard for contiguity, as no section is detached.
Each district must have approximately the same number of residents, the state Supreme Court ruled in a 2018 challenge to a previous congressional map.
To determine how many residents should reside in each district, the total population of the state is divided by the number of districts it possesses. Pennsylvania’s population of 13 million is divided by 17 districts, making the ideal population size of each district around 764,865. Deviation from this number is permissible, according to the Pennsylvania Supreme Court, but must be under 1%.
The proposed map has virtually no deviation in population size in each district.
However, in testimony before the House State Government Committee on Thursday, Holt suggested she would have preferred a greater deviation in population to allow for fewer municipal divisions. She said she was adhering to preferences previously expressed in a committee meeting hosted by House Republicans.
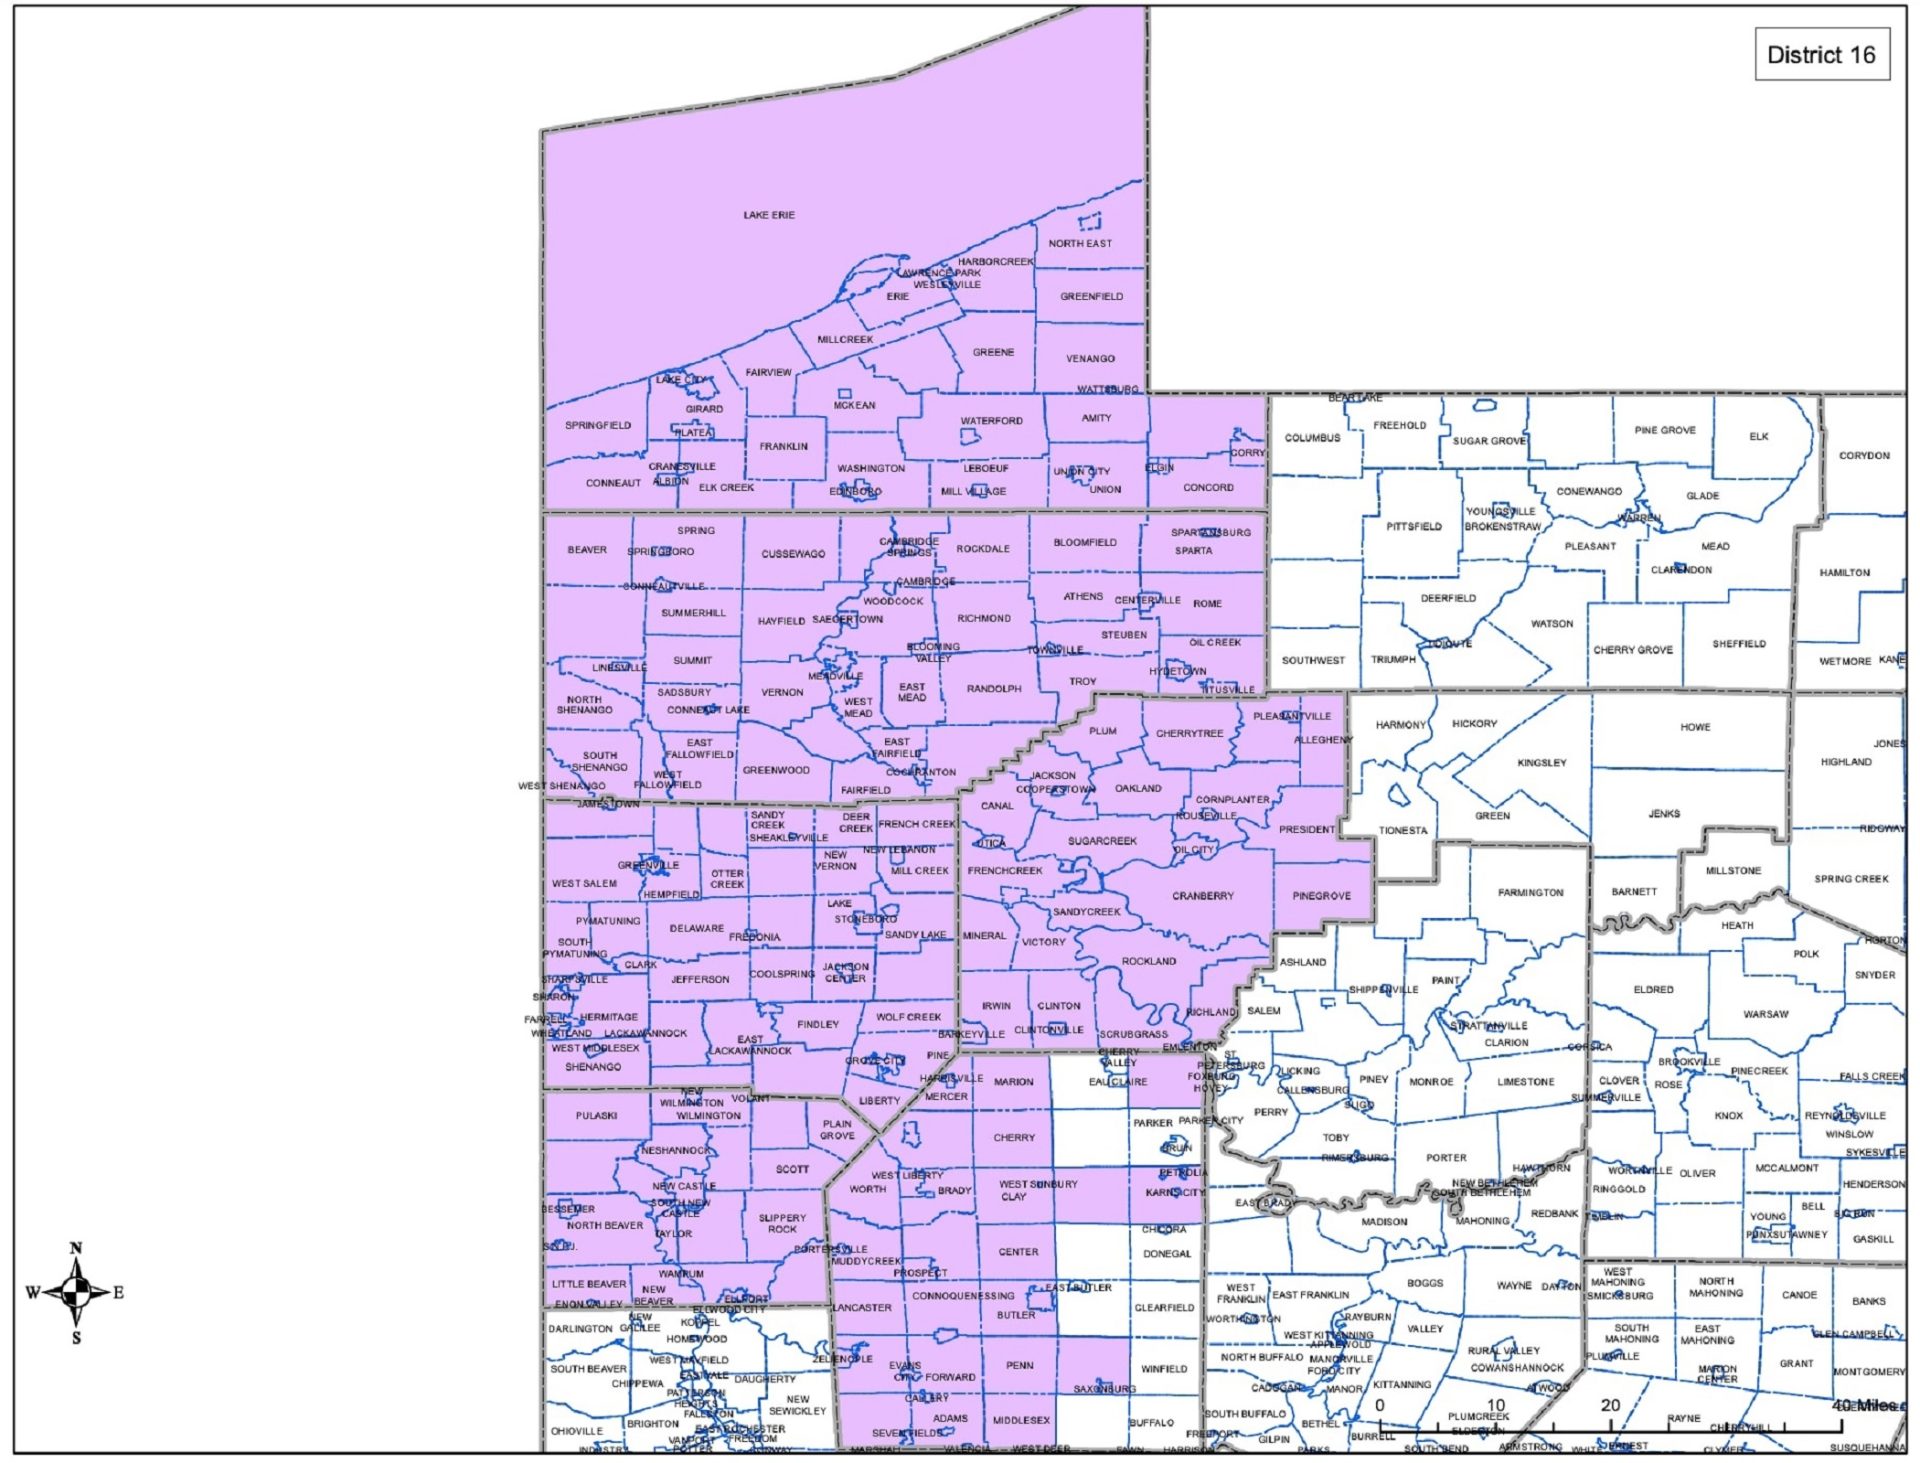
The preservation of counties and other political boundaries such as municipalities, townships, and even voting precincts is an effort to keep communities together. The largest unit that can be split is counties. However, some county splits are necessary when the county itself is too large to be contained in one district. Holt chose to focus her efforts on keeping all voting precincts together.
In terms of county splits, Dave’s Redistricting App, a mapping website dedicated to creating and analyzing district maps, gave Holt’s map a slightly better score on splitting than the current congressional map. The current congressional map has 19 county splits across 14 counties, Holt’s map splits 14 counties 16 times.
“The purpose of drawing this map was to illustrate that it is possible to create a congressional plan with a zero population deviation that divides no voting precinct, and that it is possible to achieve this goal while balancing other priorities,” Holt said Thursday.
Screenshot of map via House State Government Committee
Proposed District 16 groups together six counties, keeping five completely intact and the majority of the sixth together. Its boundaries also follow municipal and precinct lines.
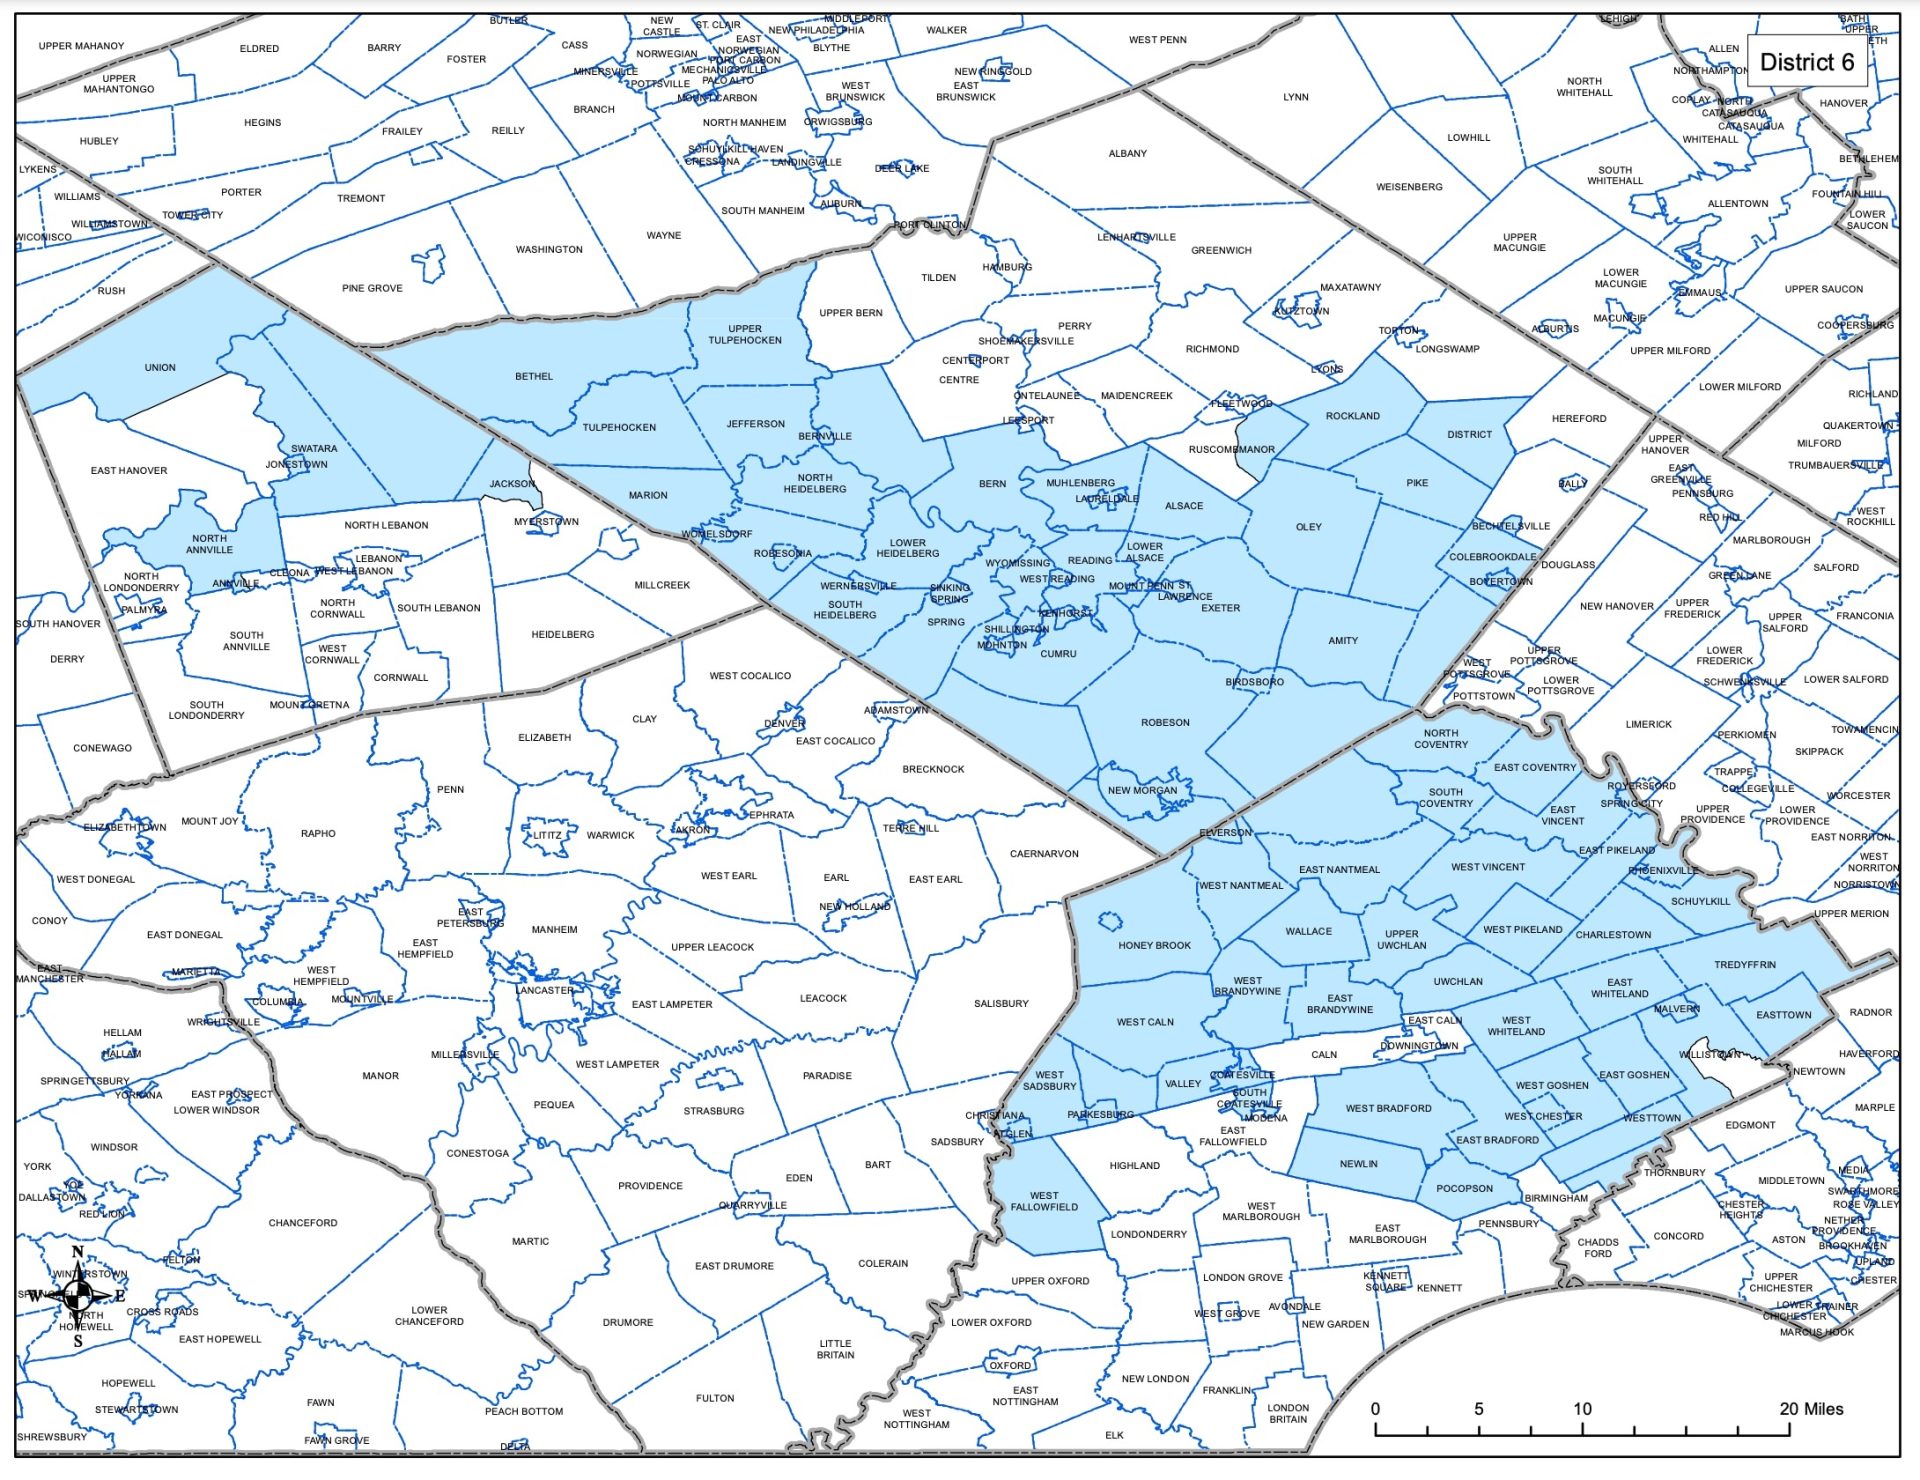
Compactness is meant to ensure that no part of a district is too isolated or unreachable. There are several different metrics to measure compactness, though neither the Pennsylvania Supreme Court nor the legislature has set a standard.
One of the most commonly used metrics to score compactness is the Poslby-Popper test, which measures how indented districts are. On a scale of 0 to 1, with 1 representing maximum compactness, Holt’s map only hits 0.27. The current congressional map scores slightly better, at 0.33.
Holt’s emphasis on equal population and minimizing splits caused this loss of compactness.
The result: long sprawling districts that have protrusions or tentacles. The shapes can confuse voters as to which legislator represents their neighborhood, and drag voters into an unfamiliar community for the sake of keeping precincts together, said Anne Hanna, who won a statewide mapping competition as a member of Concerned Citizens for Democracy.
Hanna specifically pointed to Chester County and Philadelphia, which under the proposed map both have districts protruding into them in irregular shapes.
“Those extreme maps — like what she’s done — tend to just completely throw one or more other values in the trash to satisfy the one that they’re trying to do,” Hanna said. “It’s a cool technical exercise, but extremizing one value to the exclusion of everything else is not how you make a good map for Pennsylvania.”
Screenshot of map via House State Government Committee
Proposed District 5 shows the consequence of prioritizing equal population and minimizing splits. The district is not compact and stretches across several counties.
Partisan fairness measures whether a districting plan is reflective of the partisan divide of the state.
Many different facets contribute to this metric, including proportionality — looking at whether the likely results of elections in each district, based on past electoral data, would result in a group of elected officials that is reflective of the ratio of Democratic and Republican voters in the state.
The proposed map was rated “Very Bad” by Dave’s Redistricting App and labeled anti-majoritarian. In a hypothetical election, Democrats would “probably receive roughly 52.46% of the total votes,” but “only win 47.44% of the seats.”
The Princeton Gerrymandering Project, a nonpartisan group that conducts data analysis on district plans across the country, combines a few metrics to assess the fairness of a map. One such factor is partisan bias, which measures the difference in seat shares between the parties if each party were to capture 50% of the statewide vote.
Holt’s map has an 8.8% partisan bias favoring Republicans.
Another metric is the average percentage of votes that a party needs to win a district. If one party needs higher percentages of voters to win elections, it indicates that their voters could be unnaturally packed into a district or spread out unfairly.
The “Packed Wins” metric quantifies the difference between the average win percentages, and Holt’s map has a 4.5% bias toward Republicans.
The Princeton Gerrymandering Project gave the map a B rating for overall partisan fairness.
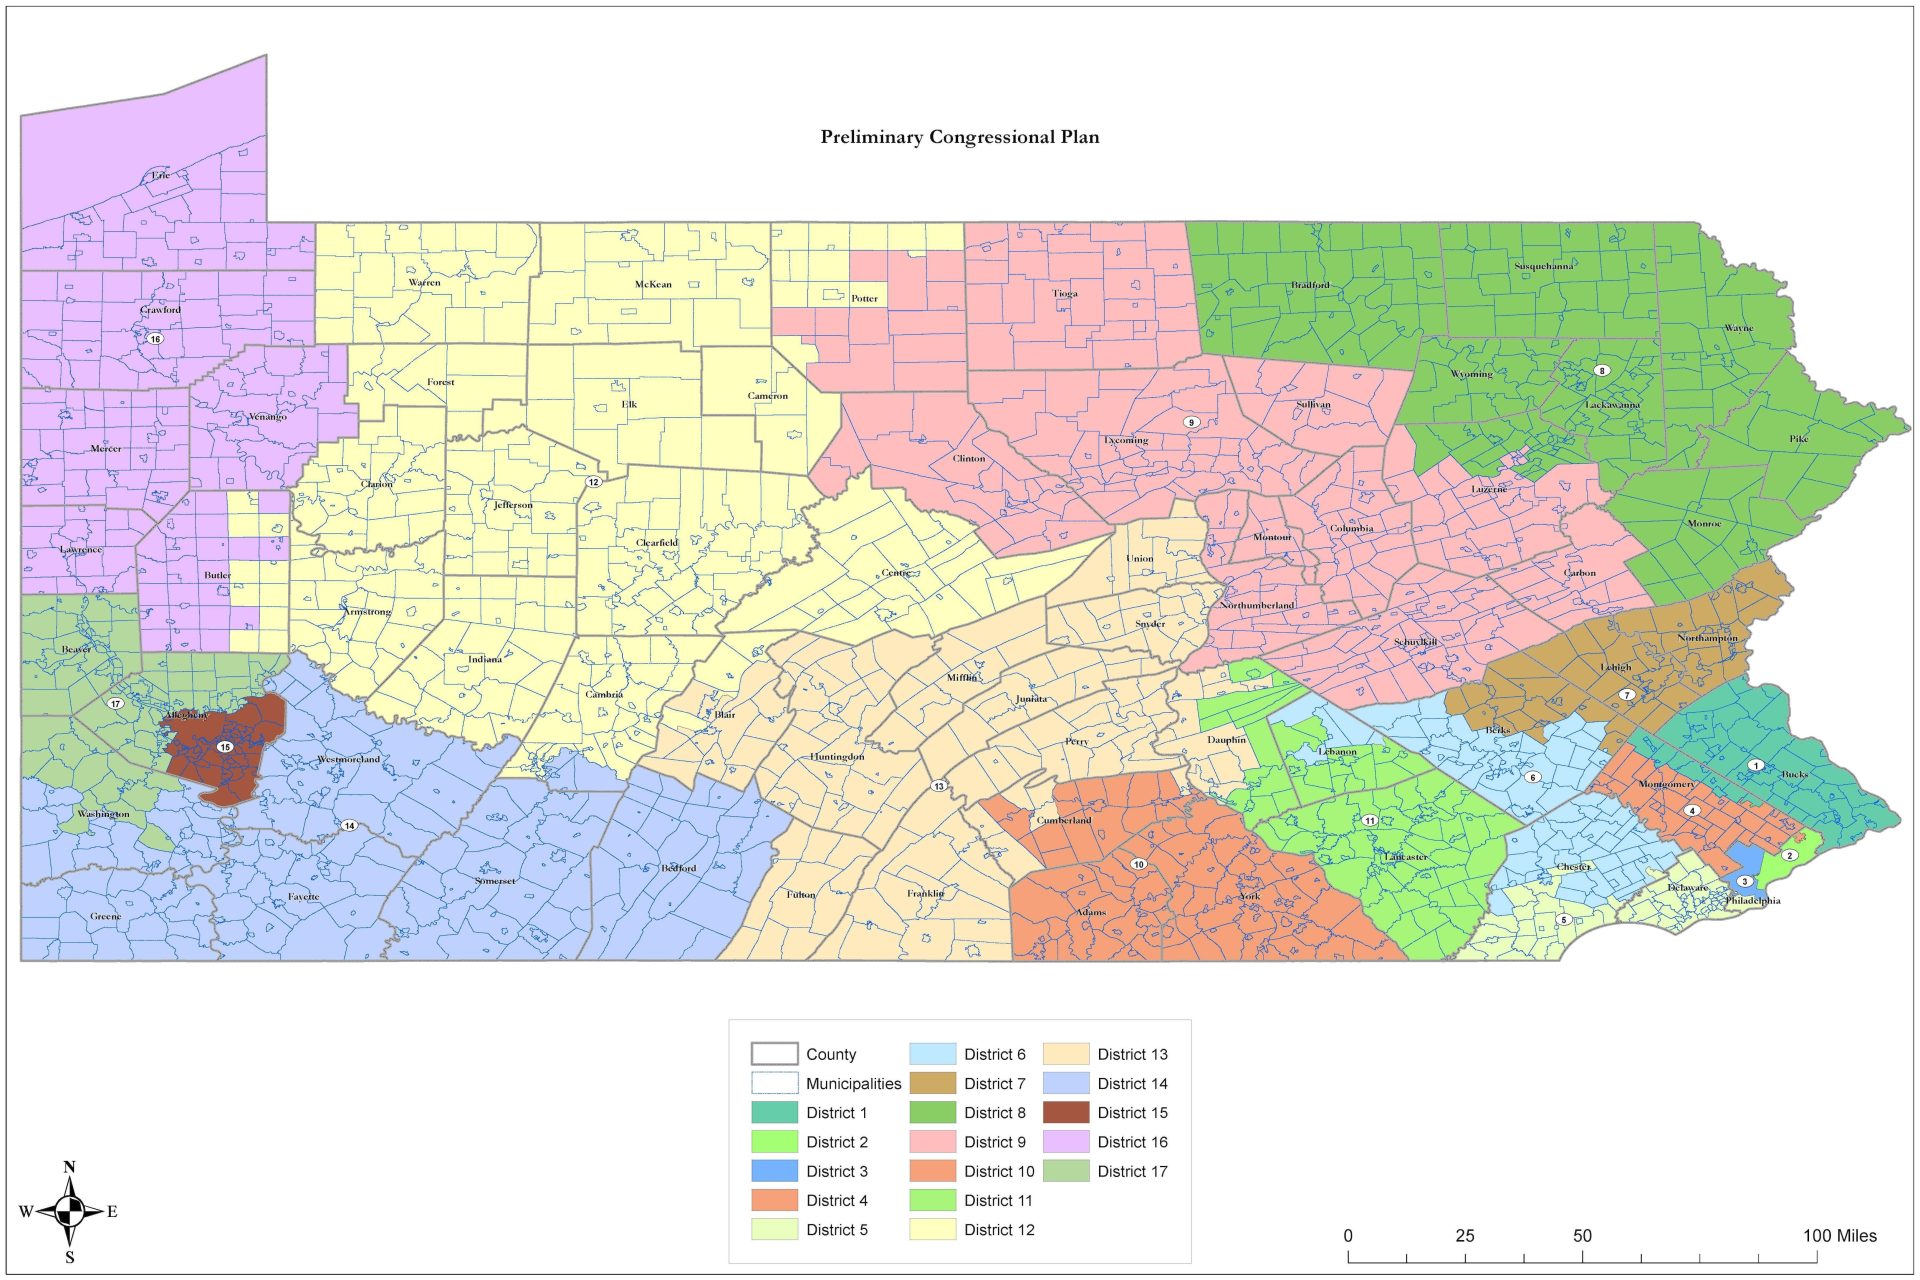
Pennsylvania House State Government Committee
The Pennsylvania House State Government Committee’s preliminary congressional map, released Dec. 8.
Another factor to consider is the efficiency gap, which indicates the number of “wasted votes” in each election or the number of votes that don’t contribute to a candidate’s victory. The difference in efficiency between the two parties should be as small as possible to represent an unbiased map.
The data journalism site FiveThirtyEight found Holt’s map had an efficiency gap favoring Republicans at +3.5 while the current map has an efficiency gap that favors Democrats at +1.
An emerging criterion is competitiveness, which measures how many districts have a relatively even balance between Democratic and Republican voters. Redistricting advocates say that this will hold legislators more accountable to voters, as their districts are less “safe.”
Dave’s Redistricting App, the Princeton Gerrymandering Project, and FiveThirtyEight all deem Holt’s map to be fairly competitive, and comparable to the current congressional maps in that measure.

We spotlight and uplift the creators around us, featuring amazing artists, musicians, authors, chefs, dancers, designers, photographers, and more.